|
Skills level: Advanced I am using Power Query more and more often to automate tasks by setting up the steps that it takes to clean up certain reports that I receive on a monthly basis. As soon as the latest report is out, Power Query knows exactly what to do with it, and cleans it up exactly the same way it did last time. It saves a lot of time and eliminates tedious processing and gets the file pivot-ready or ready to analyse in no time. Very soon after learning the basic functions of Power Query, I got stuck with an error in my date column. What can possibly be wrong with a date? I spent some time reading up (no, Googling) for solutions and found the reason why power query cannot process the dates (in some instances) in an imported file.
3 Comments
Skills level: Advanced Power Query is by far one of my favourite excel features. I am sure that you have dealt with messy data reports that just make your life difficult. It wastes so much time to rearrange columns, rows or cells, deal with blank entries, empty spaces, duplicates, unnecessary columns, messy formats… You name it, we have all seen it. Power query is there to save the day. Literally… If you know how to use power query, it will save so much time, you will have days left over at the end of the month with nothing to do! Power query has a number of functions that you can apply to your data which is specifically designed to clean up and transform your data. It deals with the typical problems that you are faced with when working with all sorts of reports with different layouts and formats. It then stores or remembers the steps that you have taken, and re-apply them when new data is added to your report. It almost works like a macro would, but you can use power query without having to learn any coding.
It is really a powerful tool, and deals with those boring repetitive tasks, that you perform week after week, month after month, so that you can concentrate on the more important things in your career or in your life. Skills level: Advanced
With a simple data set, you can extract quite a lot of useful information with the click of a few buttons within a pivot table. In an excel sheet, Mark, the financial manager of a hardware store, has a list of sales invoices for the past 3 months. The list contains only the invoice number, the invoice amount and the sales person who performed the transaction. At first, it seems like he has very limited data to work with, but you will be surprised by what he is able to extract from this data using pivot tables. And it can be done in minutes, if not seconds! He needs to report to his seniors and give a more detailed analysis of what is happening in his store. A few questions he needs answered are the following:
Skill level: Advanced One of the more exciting features of Excel, is its ability to create interactive charts - charts that change instantly as you change the criteria. Not only is it very impressive and makes you look like an expert, it is actually very easy to set up. Just to give you an idea what an interactive chart would look like, see the chart below. By selecting the relevant department, the chart changes to show only the turnover data for the selected department.  (Don't pay too much attention to the figures, it might not make a lot of sense - I just used random data to generate the chart).
So here’s how to create an interactive pivot chart with the use of a slicer. I have put together a simple data table with 3 columns for Date, Turnover and Department. There are 3 departments and the turnover data stretches over 6 years. Skills level: Advanced In this lesson, I will illustrate how to use the SUMIF formula. It is a very nifty formula that you can use when you need to sum only certain items according to specific criteria. Imagine for example that you have a fruit cart. You sell Apples, Oranges and Peaches. For every sale that you make, you enter the date of the sale, the type and number of fruits sold, the price per fruit, as well as the total sales neatly into an excel table. At the end of the month, you want to see how much sales you made per fruit, and also how many fruits you have sold of each. 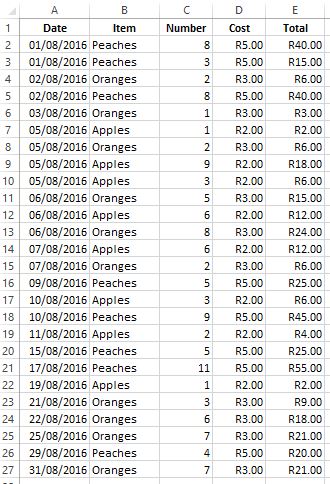 At the end of the month, you want to calculate how many apples, oranges, and peaches you have sold respectively, and how much money you have made with each fruit.
Next to my data set, I created a simple table for my totals as follows. |
Carine HoughHi, and welcome to my blog :) I am an Excel enthusiast and want to help others keen on improving their own Excel skills. I hope you learn something useful on my blog. 
Categories
All
|
