|
Skills level: Advanced With a simple data set, you can extract quite a lot of useful information with the click of a few buttons within a pivot table. In an excel sheet, Mark, the financial manager of a hardware store, has a list of sales invoices for the past 3 months. The list contains only the invoice number, the invoice amount and the sales person who performed the transaction. At first, it seems like he has very limited data to work with, but you will be surprised by what he is able to extract from this data using pivot tables. And it can be done in minutes, if not seconds! He needs to report to his seniors and give a more detailed analysis of what is happening in his store. A few questions he needs answered are the following:
Below is an extract of his data for the last 3 months. There are about 500 records in total: 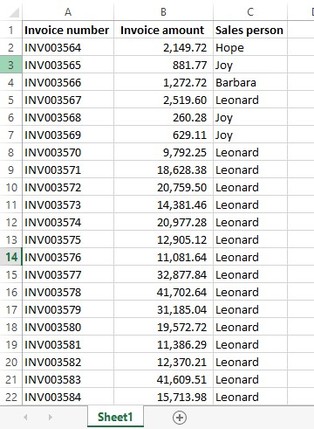 Let’s help Mark answer his questions step by step. Start by inserting a pivot table. Highlight the data range (shortcut CNTRL and A) and on the Insert tab, select Pivot table. Insert on the same worksheet, in Cell E1.  How much revenue did each sales person bring in? Drag Sales Person into the Rows field, and Invoice amount to the Values field to quickly summarize the sales value for each sales person. I have also changed the number format to make the numbers more readable.  You can also sort the results from most sales to least sales. Simply right click on any one of the values in the second column of your pivot table, choose Sort and select Largest to Smallest.  From the summary, Mark can tell that Leonard made the most sales (in value), followed by Barbara, then Joy, and finally Hope. 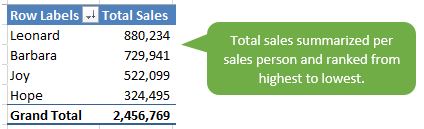 He can also evaluate as a percentage, how much each of the above sales employees contributed to sales. Percentages are usually easier to compare than numbers. Drag the Invoice Amount into the Values field again, so that it appears twice. You will see 2 columns in your pivot table with the same values. Select one of the cells in the column on the right, and select “Show Values As” and select the second option from the top “% of Grand Total” to convert the values to a percentage.  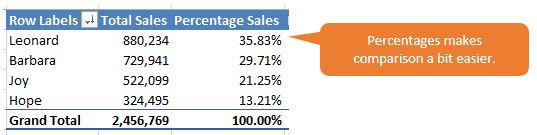 How many sales did each sales person perform? Drag the invoice amount into the Values field for a third time. Once again, another column will be added with the same figures as the first column. To count the number of sales each sales person performed, right click on any one of the values in the newly added column, select “Summarize values by” and select “Count”. Selecting this option will count the number of entries (invoices and therefore number of sales performed) in the data set for each sales person.  From this analysis, Mark can tell that even though Leonard contributes the most towards sales, Joy actually performed a higher number of sales. She has served more customers, but her invoice values were low compared to Leonard. See below how you can include average invoice information in your pivot table to further analyse the data and extract more valuable information. What is the average invoice amount for each sales person? Follow the same steps as above, but instead of choosing “Count”, select “Average”.  The above information can even be used in performance evaluations. Joy does not have a problem with engaging with customers, as she serves many more than her fellow colleagues, but she may struggle with marketing more or pricier goods to customers. On the other hand Leonard’s sales volume is reasonably lower than that of Joy’s, but his high invoice average shows that he is very successful in selling more and/or pricier goods to clients, which is beneficial to the business. His marketing skills seems to be a lot better than Joy’s. Hope on the other hand has both a low total sales value and number of sales performed. She may have to up her game if she wants that promotion. However, compared to Joy, her average invoice amount looks a lot better. She therefore may have the marketing skills needed to make good sales, but will have to increase her activity in the shop and actively engage with more customers. 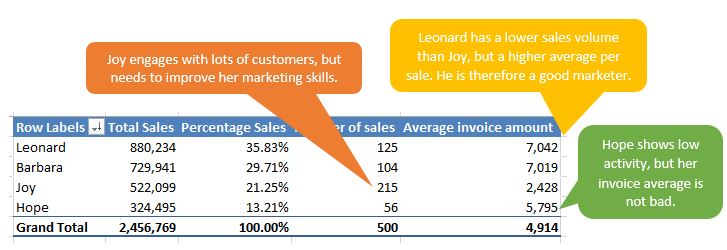 To finish off the simple sales summary, you can rename the columns to something more appropriate, by selecting them one by one and typing a new heading. The finished result is a simple summary which gives useful information about what is going on in Mark’s store: 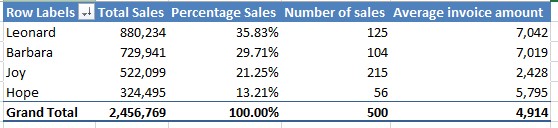
2 Comments
20/9/2022 08:30:56
Thanks for sharing your ideas and thoughts! Business doesn’t stand still - join ANNA and get the business account that can keep up with you, wherever your business takes you. 20/9/2022 09:04:05
Thanks for sharing such a informative blog! An unsecured business loan is an ideal short-term finance solution to fund company growth & expansion, provide cashflow stability, refurbish premises or hire staff. Leave a Reply. |
Carine HoughHi, and welcome to my blog :) I am an Excel enthusiast and want to help others keen on improving their own Excel skills. I hope you learn something useful on my blog. 
Categories
All
|
