|
Skills Level: Intermediate I recently had to complete a form in Excel where the ID numbers of a group of learners were required, as well as their age. I had a list of their ID numbers ready, but age is not something that you can store along with other records since it is not static data and obviously changes every year. Despising forms and admin in general, I looked for a shortcut to calculate the age with as little effort as possible, avoiding manual calculations at all cost.
3 Comments
Skills level: Intermediate Charts are a great way of displaying data visually. The reader is able to quickly spot trends and locate out-of-the-ordinary results. I often need to work with rolling year on year growth, and I assumed that there was a quick fix in Excel to include a YOY growth figure in a chart, but turns out you need to be quite creative to get the desired result. While it is quite easy to calculate the growth rate with a few columns and formula’s, you need to know some charting skills to bring it into a chart.
Skills level: Intermediate Creating a drop-down list in Excel can be a real time-saver. Imagine how much time you waste by typing in the same thing day after day, week after week when you have to complete a list or a register on a regular basis. It might not seem like much at first, but if you add up all the seconds, they add up to minutes, and repeated every week, may amount to a few precious hours over time. There are also consistency benefits that you achieve when making use of drop-down lists, especially if more than one person needs to complete the same register or list. If you had to work with a spreadsheet before where people have used all sorts of different ways to write the same thing, you will know how frustrating it is to clean it up. For example, instead of completing “Monday”, people may have typed “monday”, the abbreviation “Mon” or misspelled it as “Munday”. All these records have a different value, and cannot be summarised in a pivot table for example, since it will be treated as separate records.
Skills level: Intermediate I happened to come across the ISNUMBER and ISTEXT formula’s while looking for something else, and thought to myself, this is quite nifty… don’t know if I am ever going to use it, but cool formula. What the formula does is simply confirm whether the data contained in a cell is formatted as text (ISTEXT formula) or as a number (you guessed it, the ISNUMBER formula). Pretty cool, but why would I ever need to use it? Until the next day… A colleague asked for my help with a simple formula that just would not calculate. It kept on giving a #VALUE! error. I immediately thought of checking the formatting of the cell which contains the formula - it was formatted as a number, so no problems there, and then I continued to check the formatting of all the cells used in the calculation… Also not finding any issues. All the cells seemed to be appropriately formatted as a number, but the #VALUE! error remained. Then I remembered the ISNUMBER and the ISTEXT formula that I just learned about the day before, and decided to test it. And low and behold, one of the cells sneakily kept its formatting as text even though we changed it to number.
Skills level: Intermediate
Errors in spreadsheets can be quite annoying. Especially if it is actually not a mistake, but just as a result of the data input. One of the errors that I often come across is the #DIV/0! error when trying to divide by zero. Sometimes, when you export some or other report, it is inevitable that some of the lines will have zero values, which may result in errors when trying to perform certain calculations. You might want to take the errors out, especially if you need the result for further calculations. If you need to sum the calculated column of values for example, the result will also result in an error. Below is a sales report for the Corner Stationery Shop for the month of August. The report includes all the items available to customers (even if none were sold during the month), the total sales value, and the number of items sold in the period. Skills level: Intermediate We often need to use the same formula to calculate the same thing for a whole list of items. You may be familiar with the click & drag function that allows you to quickly fill (or copy) the same formula downwards, while Excel assumes that for each subsequent cell into which the formula is copied, the subsequent set of data needs to be used for the calculation. Let’s use an example to illustrate. Below is a simple shopping list, with columns for items, quantity and price per unit. 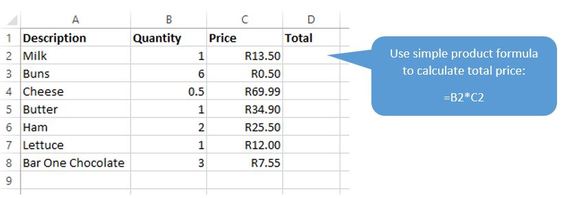 Relative References
To calculate the total cost of your shopping list, you can easily use the product function, or simply enter a multiplication formula into Cell D2 (I am going to use the second formula throughout this example, but the principle will apply to both… or any other formula for that matter): =PRODUCT(B2,C2) OR =B2*C2 Skills level: Intermediate Sometimes, when working with very large spreadsheets, you find yourself navigating back and forth from left to right trying to see all the data on your worksheet. It is quite a nuisance when you have a spreadsheet that has so many columns that does not fit all on your screen. But you also don’t want to delete the columns, because you might want to use the data in the other columns another time. Below is a list of client data. Initially, you only see data completed up to column M. 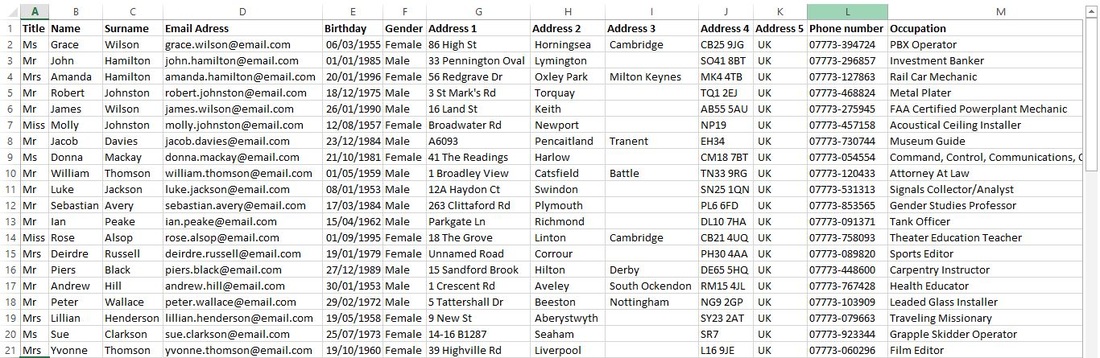 But if you scroll further to the right, there are more columns after Column M with more data. 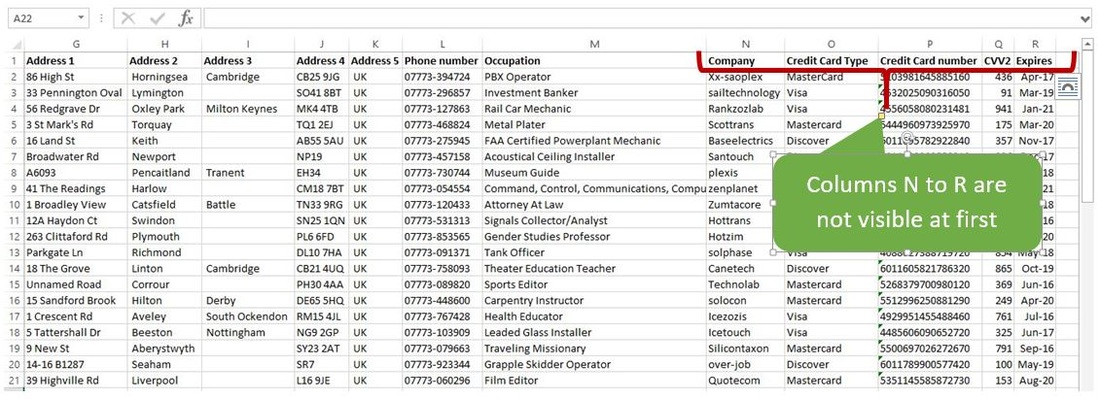 |
Carine HoughHi, and welcome to my blog :) I am an Excel enthusiast and want to help others keen on improving their own Excel skills. I hope you learn something useful on my blog. 
Categories
All
|
