|
Skills level: Advanced The need to obtain the last value in a column of values is quite common. Think about a simple statement where you have a running total in the last column, and as a summary, you want to show the balance at the bottom. Every time that a new line or entry is entered, you want the balance at the bottom to adjust to show the last running total. 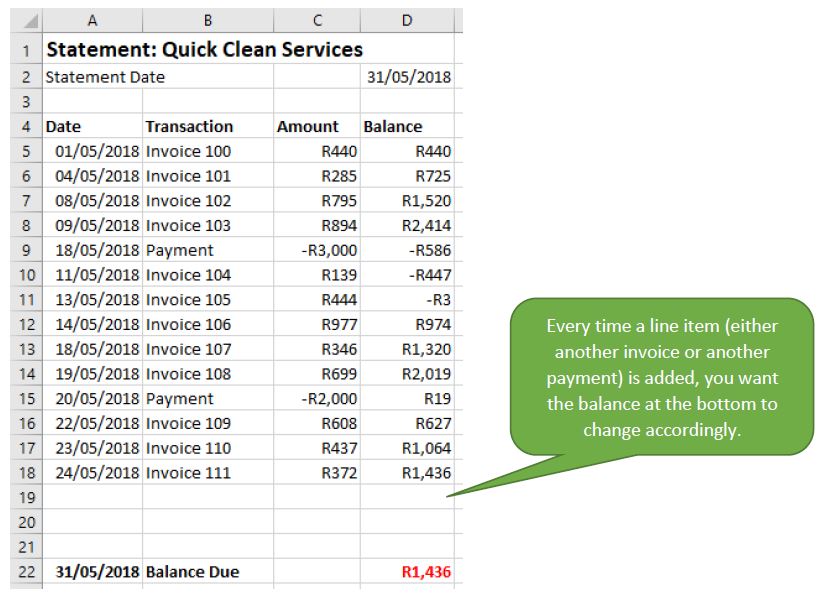 There are a few ways in which you can do this.
28 Comments
Skills Level: Intermediate
The IF function in Excel must be one of the most powerful. While it is very simple and easy to understand in its simplest form, the ability to nest functions within the IF function to solve complex problems, makes it extremely useful. Its capability is only limited to its user’s own logical and analytical reasoning ability. The syntax for the simple IF function is as follows: =IF(logical_test, [value_if_true], [value_if_false]) Skills Level: Intermediate
I have done a post before explaining the basics of dates and how Excel’s referencing system allows you to make calculations with dates. If you missed the post, you can read it here. This blog post takes it a step further, and will illustrate a few very handy formulas to determine the last day of the month, when the next working day is, what day of the week a certain date falls and so on. Skills Level: Intermediate I recently had to complete a form in Excel where the ID numbers of a group of learners were required, as well as their age. I had a list of their ID numbers ready, but age is not something that you can store along with other records since it is not static data and obviously changes every year. Despising forms and admin in general, I looked for a shortcut to calculate the age with as little effort as possible, avoiding manual calculations at all cost.
Skills level: Advanced I am using Power Query more and more often to automate tasks by setting up the steps that it takes to clean up certain reports that I receive on a monthly basis. As soon as the latest report is out, Power Query knows exactly what to do with it, and cleans it up exactly the same way it did last time. It saves a lot of time and eliminates tedious processing and gets the file pivot-ready or ready to analyse in no time. Very soon after learning the basic functions of Power Query, I got stuck with an error in my date column. What can possibly be wrong with a date? I spent some time reading up (no, Googling) for solutions and found the reason why power query cannot process the dates (in some instances) in an imported file.
Skills level: Intermediate Charts are a great way of displaying data visually. The reader is able to quickly spot trends and locate out-of-the-ordinary results. I often need to work with rolling year on year growth, and I assumed that there was a quick fix in Excel to include a YOY growth figure in a chart, but turns out you need to be quite creative to get the desired result. While it is quite easy to calculate the growth rate with a few columns and formula’s, you need to know some charting skills to bring it into a chart.
Skills level: Intermediate Creating a drop-down list in Excel can be a real time-saver. Imagine how much time you waste by typing in the same thing day after day, week after week when you have to complete a list or a register on a regular basis. It might not seem like much at first, but if you add up all the seconds, they add up to minutes, and repeated every week, may amount to a few precious hours over time. There are also consistency benefits that you achieve when making use of drop-down lists, especially if more than one person needs to complete the same register or list. If you had to work with a spreadsheet before where people have used all sorts of different ways to write the same thing, you will know how frustrating it is to clean it up. For example, instead of completing “Monday”, people may have typed “monday”, the abbreviation “Mon” or misspelled it as “Munday”. All these records have a different value, and cannot be summarised in a pivot table for example, since it will be treated as separate records.
Skills level: Advanced Power Query is by far one of my favourite excel features. I am sure that you have dealt with messy data reports that just make your life difficult. It wastes so much time to rearrange columns, rows or cells, deal with blank entries, empty spaces, duplicates, unnecessary columns, messy formats… You name it, we have all seen it. Power query is there to save the day. Literally… If you know how to use power query, it will save so much time, you will have days left over at the end of the month with nothing to do! Power query has a number of functions that you can apply to your data which is specifically designed to clean up and transform your data. It deals with the typical problems that you are faced with when working with all sorts of reports with different layouts and formats. It then stores or remembers the steps that you have taken, and re-apply them when new data is added to your report. It almost works like a macro would, but you can use power query without having to learn any coding.
It is really a powerful tool, and deals with those boring repetitive tasks, that you perform week after week, month after month, so that you can concentrate on the more important things in your career or in your life. Skills level: Advanced
With a simple data set, you can extract quite a lot of useful information with the click of a few buttons within a pivot table. In an excel sheet, Mark, the financial manager of a hardware store, has a list of sales invoices for the past 3 months. The list contains only the invoice number, the invoice amount and the sales person who performed the transaction. At first, it seems like he has very limited data to work with, but you will be surprised by what he is able to extract from this data using pivot tables. And it can be done in minutes, if not seconds! He needs to report to his seniors and give a more detailed analysis of what is happening in his store. A few questions he needs answered are the following:
Skills level: Intermediate I happened to come across the ISNUMBER and ISTEXT formula’s while looking for something else, and thought to myself, this is quite nifty… don’t know if I am ever going to use it, but cool formula. What the formula does is simply confirm whether the data contained in a cell is formatted as text (ISTEXT formula) or as a number (you guessed it, the ISNUMBER formula). Pretty cool, but why would I ever need to use it? Until the next day… A colleague asked for my help with a simple formula that just would not calculate. It kept on giving a #VALUE! error. I immediately thought of checking the formatting of the cell which contains the formula - it was formatted as a number, so no problems there, and then I continued to check the formatting of all the cells used in the calculation… Also not finding any issues. All the cells seemed to be appropriately formatted as a number, but the #VALUE! error remained. Then I remembered the ISNUMBER and the ISTEXT formula that I just learned about the day before, and decided to test it. And low and behold, one of the cells sneakily kept its formatting as text even though we changed it to number.
|
Carine HoughHi, and welcome to my blog :) I am an Excel enthusiast and want to help others keen on improving their own Excel skills. I hope you learn something useful on my blog. 
Categories
All
|
